Development of the C–P Diagram: A Novel Thermodynamic Framework for Visualizing and Characterizing Thermal Cycles via Geometric Symmetry
Keywords:
C–P diagram, thermodynamic cycles, geometric symmetry, techno-economic analysis, finite-time thermodynamics, Brayton cycle, system optimizationAbstract
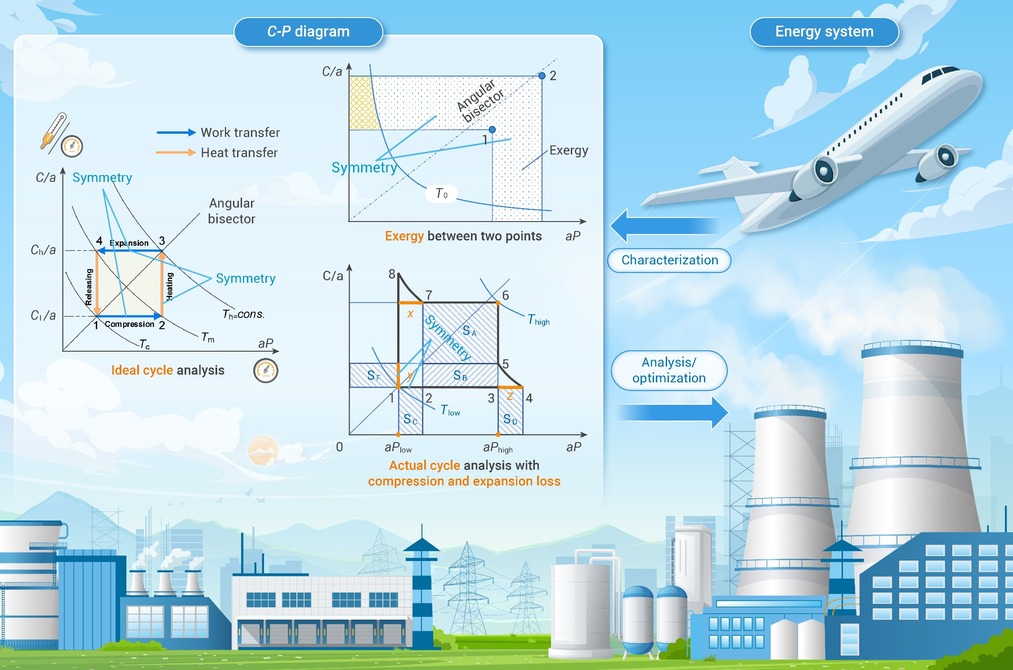
Conventional thermodynamic cycle analysis tools mainly focus on fundamental state variables or energy transfer paths, yet they often fail to capture the intrinsic geometric symmetry inherent to thermodynamic systems. This study presents the C–P diagram, a novel graphical framework that integrates geometric symmetry into thermodynamic analysis, offering multiple analytical benefits. The proposed method enhances conceptual understanding of thermodynamic cycle principles, improves analytical visualization through symmetric geometrical representation, and facilitates a transition from component-based to system-wide evaluation. Although conceptually related to entropy-based approaches in examining heat-to-work conversion processes, the C–P diagram extends its applicability beyond heat exchange to encompass work-generating cycles. The study demonstrates its versatility through applications in exergy assessment, irreversible processes, finite-time thermodynamics, and multi-process coupling analyses. Distinct from conventional qualitative diagrams, the C–P diagram provides a quantitative and geometrically concise visualization of exergy, elucidating complex behaviors such as the asymmetric maximum power output of real Brayton cycles. Furthermore, it enables the determination of maximum power and efficiency under finite-rate heat transfer through geometric relationships, thereby uncovering interdependencies among process losses in coupled systems. Serving both as a complementary and pioneering analytical model grounded in symmetry and geometry, the C–P diagram represents a substantial advancement in the visualization, analysis, and optimization of thermodynamic cycles.
Downloads